Mapping the state of inclusion in the Australian workforce
DCA’s Inclusion@Work Index is a survey of 3,000 nationally representative workers in Australia that maps and tracks the state of inclusion in the Australian workforce with the aim to:
Encourage Australian organisations to be active in D&I and achieve inclusion in their workplaces – it is better for worker wellbeing and business
Biennially track Australia’s progress (or lack of) in creating Inclusion@Work
Encourage consideration of workplace inclusion for a broad set of workers – that is, not just inclusion based on gender (most commonly considered by employers) but also by age, cultural background, caring responsibilities, disability status, Indigeneity, sexual orientation, and more.
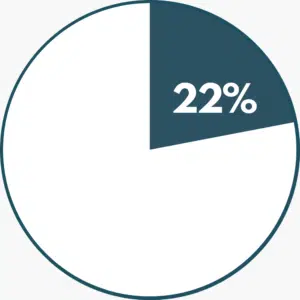
Worker experience with exclusion has increased post-pandemic
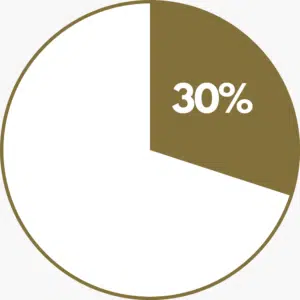
Close to 1 in 3 workers reported experiencing discrimination and/or harassment at work post-pandemic.
Workers who experienced discrimination and/or harrassment:
% Yes 2019 (pre-pandemic)
% Yes 2021 (during pandemic)
% Yes 2023 (post-pandemic)
Exclusion is higher for marginalised workers
Workers from marginalised backgrounds reported much higher experiences of discrimination and/or harassment at work:
59%
59% of First Nations workers experienced discrimination and/or harassment at work
42%
42% of workers with disability experienced it in past 12 months
41%
41% of workers with a non-Christian religion experienced discrimination and/or harassment at work
39%
39% of LGBTIQ+ workers experienced discrimination and/or harassment at work
Non-inclusive teams and managers are more common than ever
Worker reports of non-inclusive teams and managers were the highest recorded since starting the Index:
Non-Inclusive Team
Non-Inclusive Manager
Support for organisational D&I action is slipping post-pandemic, particularly from younger men
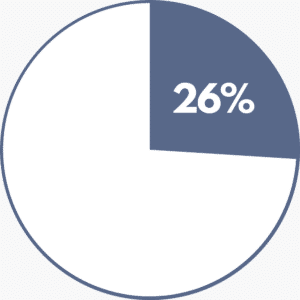
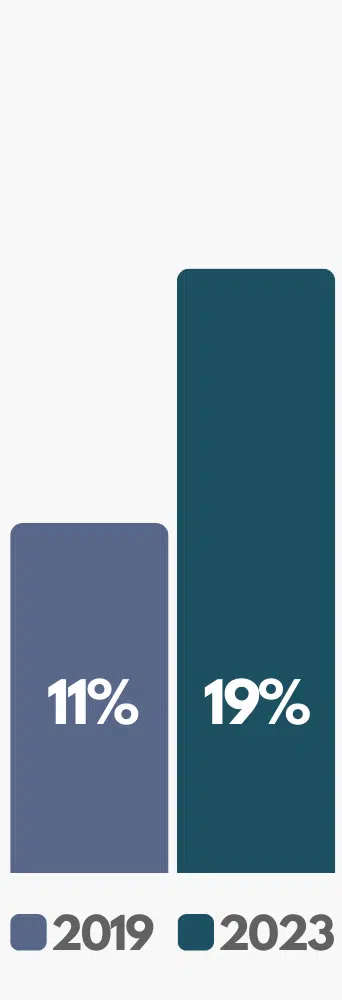
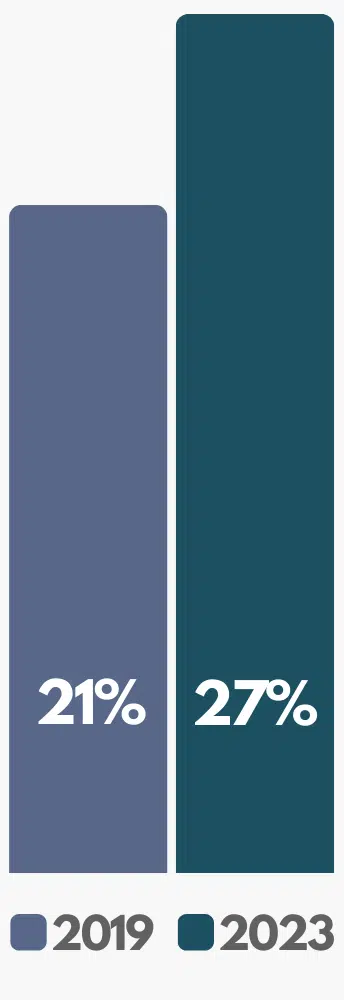
Though still the minority, 7% of workers now oppose or strongly oppose D&I action. This is the highest opposition reported since the first Inclusion@Work Index report.
Younger men who support, or strongly support, organisational D&I action:
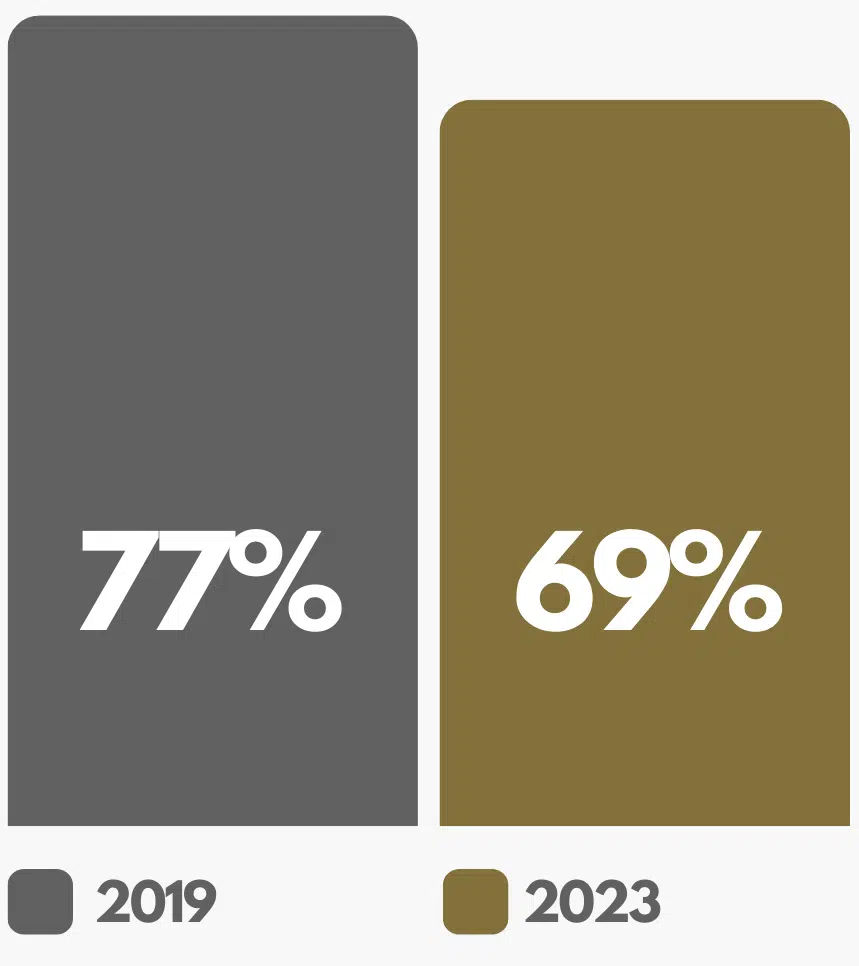
Sense of connection and contribution have decreased post-pandemic
Despite having more ways of reaching our colleagues than ever, workers report feeling less connected and able to contribute to their teams.
71%
71% reported they feel they belong as part of a team, a decrease from 77% in 2021, and 78% in 2019.
68%
68% felt able to contribute to discussions so that different views inform decisions – a drop from 76% in 2021, and 78% in 2019.
Caring responsibility remains a flex “fault line”
Contrary to hopes the pandemic would make flex work more mainstream, workers with caring responsibilities reported much higher use of flex.
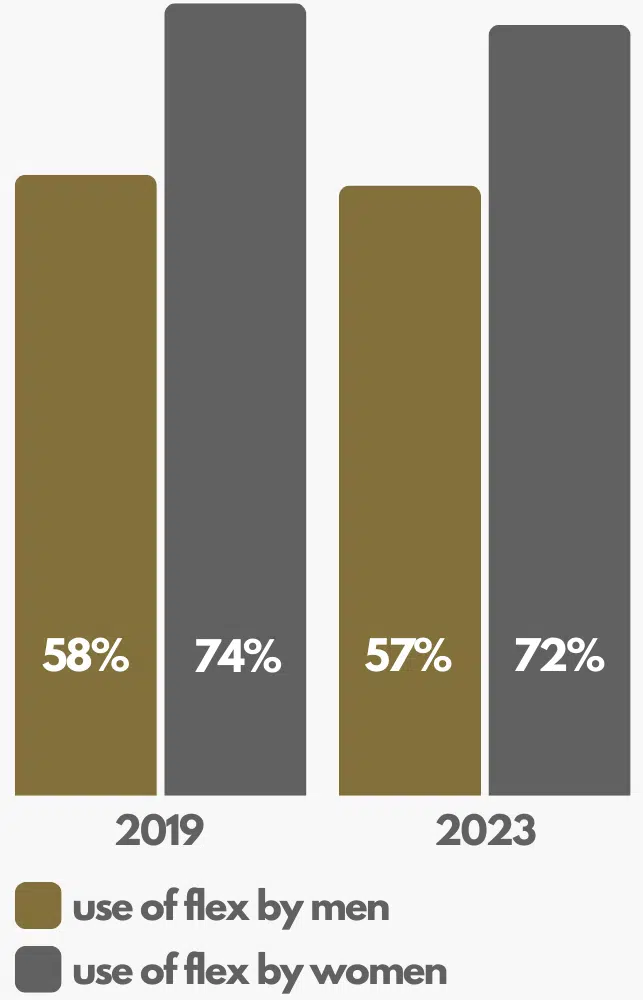
Flex also remains heavily gendered
Men continue to use far less flex than women, with a 15% gender flex gap persisting post-pandemic.
Keep reading
Explore the full report in the member-only section to delve deeper into the state of inclusion and exclusion in the Australian workforce.
Comparing pre- and post-pandemic inclusion
DCA developed the first Inclusion@Work Index survey in 2017. Since then, we have repeated the survey biennially to track workplace inclusion over time. This fourth and latest Index is uniquely positioned to capture post-pandemic Australia and provide a cohesive image of how the pandemic has impacted workplaces through comparison with edition two (2019 –2020, pre-pandemic) and edition three (2021–2022, during-pandemic).
Where you wish to refer to our research publicly, it must be correctly attributed to DCA.
Formal attribution to DCA is required where references to DCA research material are in a written format.
Citing DCA as a source will suffice where the reference is made in a verbal format.
Suggested citation: Diversity Council Australia (D’Almada-Remedios, R.) DCA Inclusion@Work Index 2023-2024: Mapping the State of Inclusion in the Australian Workforce, Sydney, Diversity Council Australia, 2024.
INCLUSION@WORK INDEX logo is a Registered Trade Mark of Diversity Council Australia Limited.
The rest of this content is restricted to DCA members.
To find out more about joining DCA please see below.
If your organisation has already signed up for membership, this will activate as soon as payment is received.